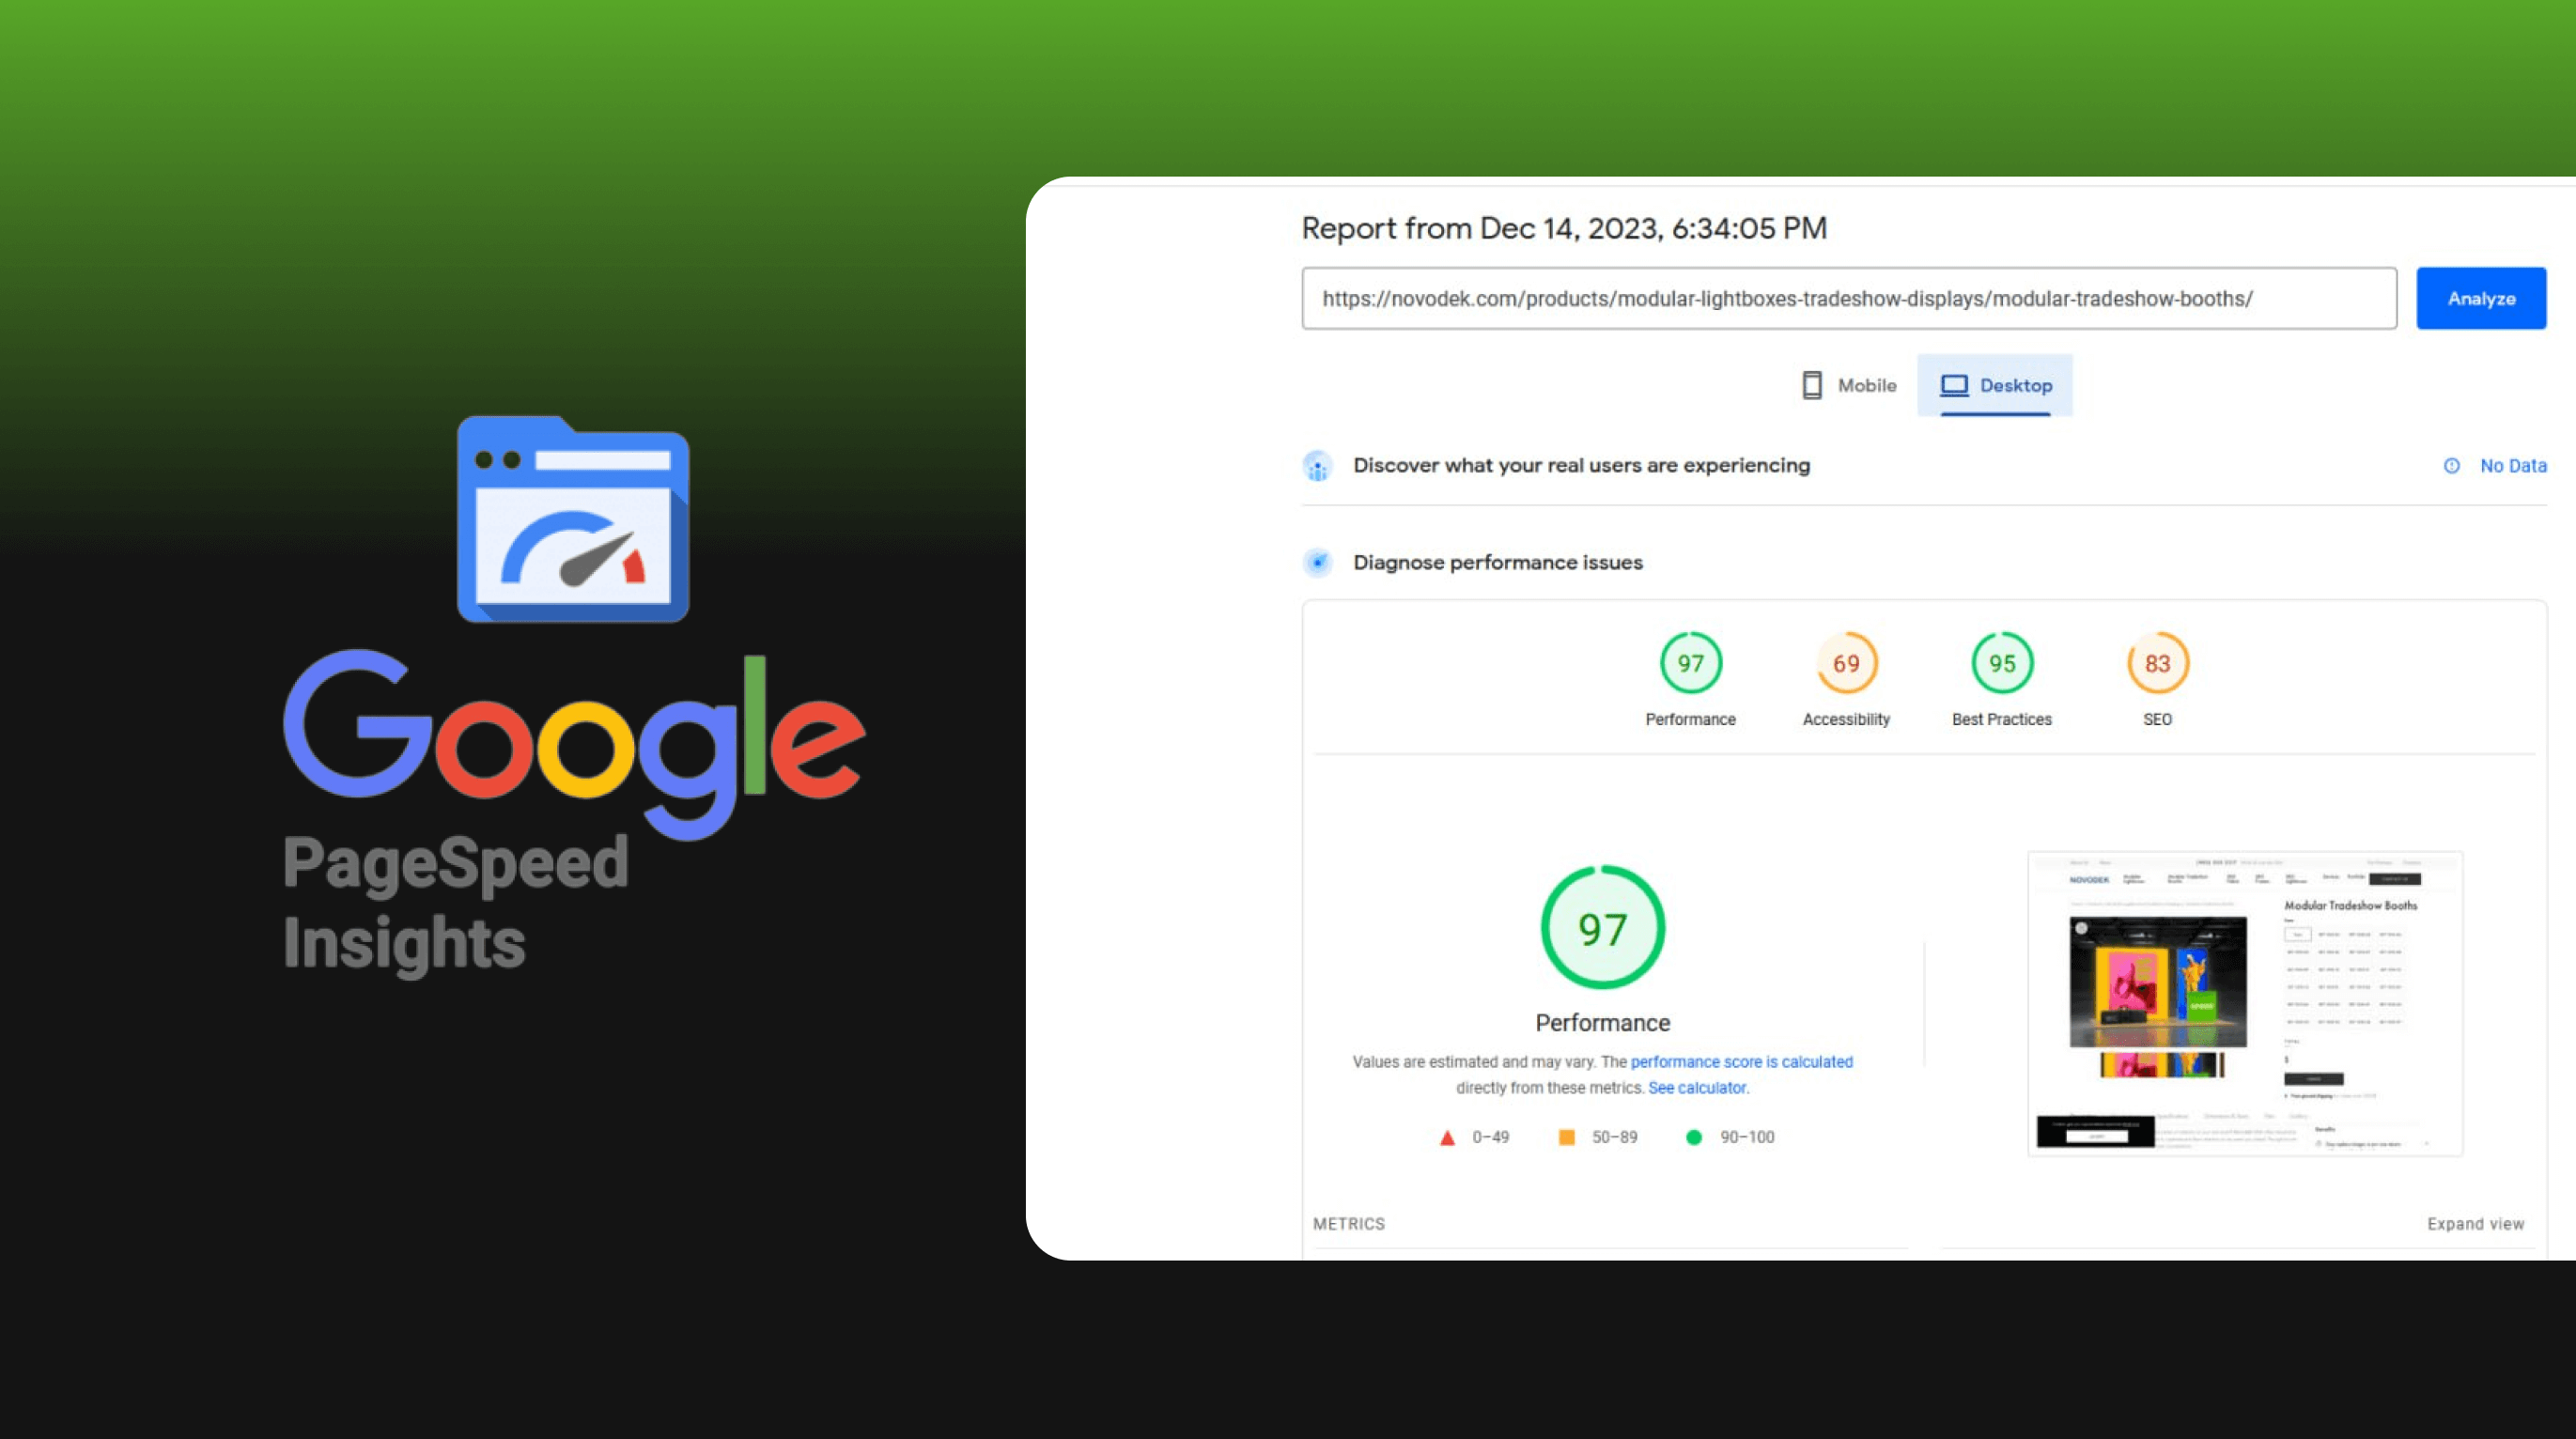
In this article, our team shares the experience of implementing an audit to identify PageSpeed issues and gives the key steps to increase site loading speed through a case study of an online lightbox and tradeshow booths store based in the USA.
At the outset of our collaboration with the Novodek online store, we were tasked with making minor adjustments to this WordPress site and implementing changes to enhance PageSpeed scores.
To enhance the loading speed of this online store, we’ve outlined specific steps and a strategy for the optimization process:
- Audit and identify design/code issues.
- Image optimization.
- Improvements to Largest Contentful Paint (LCP).
- Interaction with Cumulative Layout Shift (CLS) and Total Blocking Time (TBT).
- Optimization of the download queue of JS and CSS files.
- Visual checking and saving of important design elements after optimization.
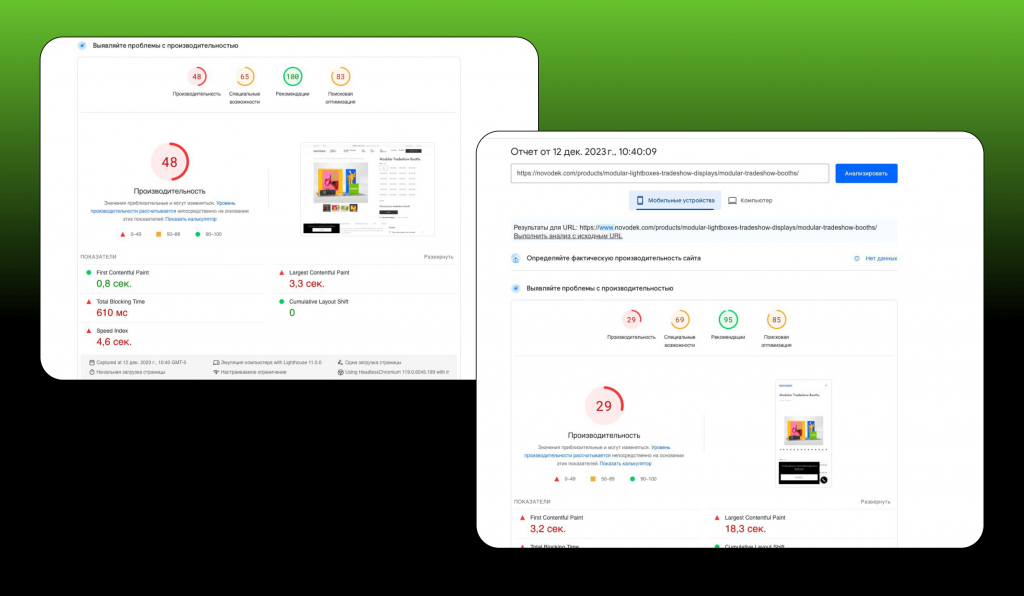
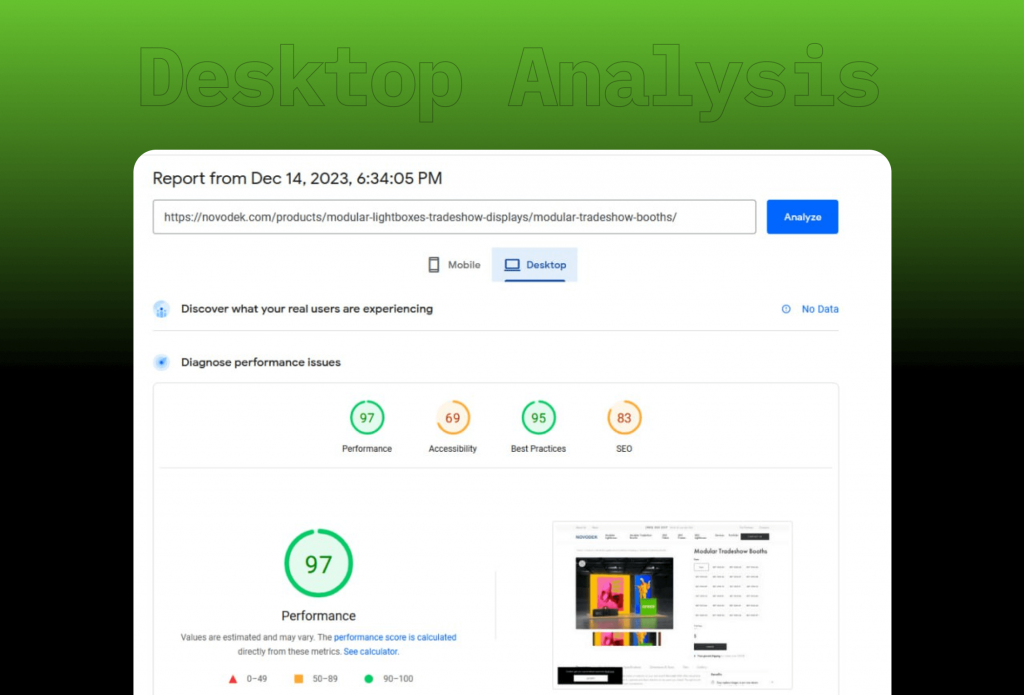
As a result, we can expect entry into the green indicator zone for desktop (90+) and come closer to the upper limit of the yellow indicator zone (70+) for mobile devices.
In the PageSpeed Insights report, we get lots of suggestions to make certain parts of the website work better and boost the overall PageSpeed score. Some of these ideas are not too hard to realize, but they can take a long time because we have to do them for each page separately, not for the whole website.
But there are some suggestions, like ‘Minimize the JavaScript code you do not use,’ that we can’t do. If we did, it would mess up how the website works and looks, and that goes against what we’re trying to achieve with our technical task from the client.

Let’s delve into the specifics of each step in the site speed optimization process that we executed:
Audit and identify design/code issues
As our team did not handle the initial development and launch of Novodek, our first step was to conduct a comprehensive investigation into how the online store was implemented. We thoroughly tested various functionalities to ensure their stability, preventing any unintended disruptions during subsequent optimization steps. We recommend a meticulous analysis of all site elements to identify speed-affecting factors that can be optimized without compromising the site’s appearance.
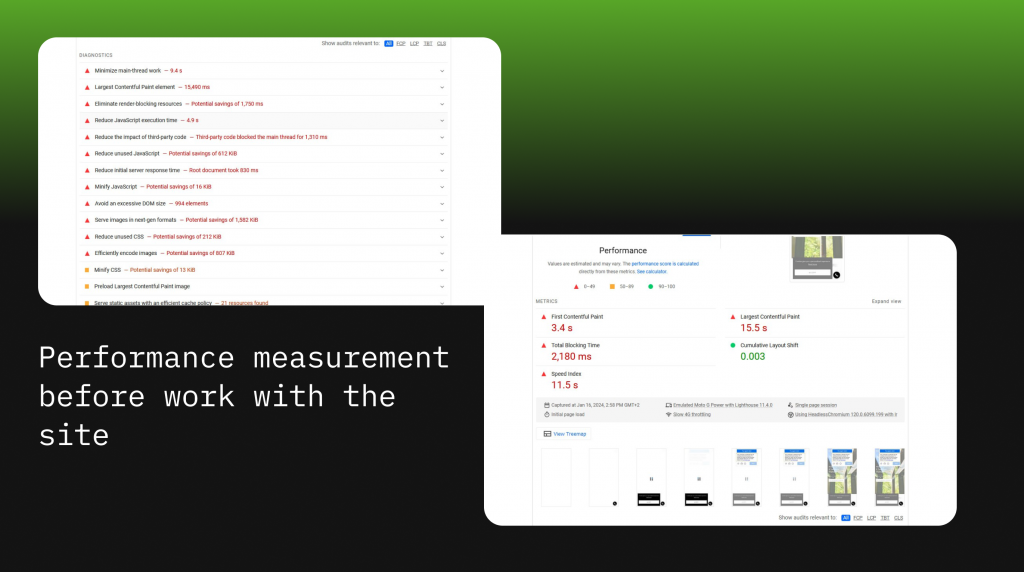
Image optimization
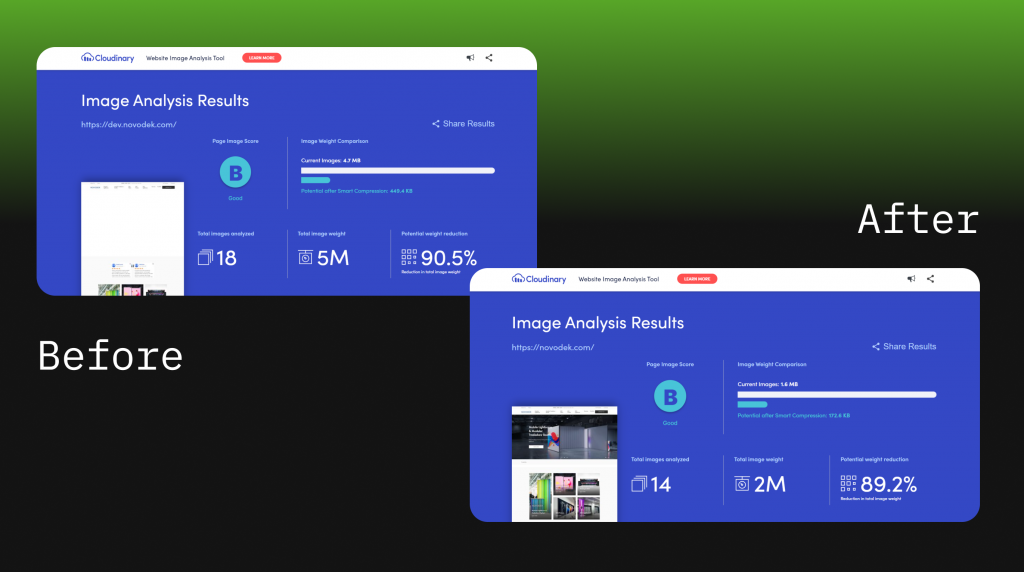
First and foremost, it’s crucial to display images in the correct size. We noticed that the images on the site were too big, which was a big reason why the PageSpeed indicator dropped.
- Remember: Huge images can make your pages load really slow and use up more data, so fixing this is a big deal for speed improvement.
- Solution:
✓ Utilize image optimization tools.
✓ Pick the best image type (like WebP for websites) because it keeps good quality but takes up less space.
✓ Convert images to the WebP format and implement it on the backend of the site, ensuring the process occurs on the server.
- The aim is to make images smaller without losing much quality, finding the right balance between loading quickly and looking good.
Improvements to Largest Contentful Paint (LCP)
To boost PageSpeed Insights scores, now let’s focus on optimizing the Largest Contentful Paint indicator.
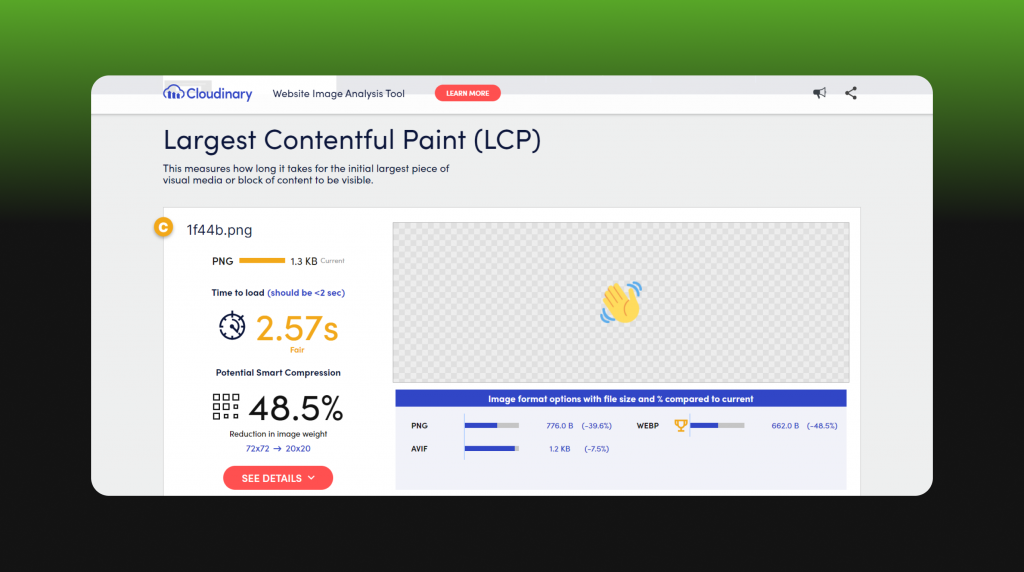
LCP is the time it takes for most of the content on the visible part of the screen to become fully viewable. A good target is around 2.5 seconds, and it significantly influences the overall page load speed rating. This indicator relies on the download speed of the largest media file that is immediately displayed to the user upon page load.
Typically, these are elements like banners or main product images. To optimize them, it’s recommended to turn off ‘lazyload’ for these elements and introduce ‘preload,’ ensuring they get priority in the loading queue
- Lazyload: Usually, lazyload postpones loading images until they’re visible to the user. However, this delay can impact the display of the largest content, affecting LCP.
- Preload: By turning off lazyload and using preload, you can prioritize the largest media files in the download queue, making sure they’re displayed quickly.
Additionally, it’s crucial to take into account the influence of the preloader, as its presence can hinder the display of the main content on the page, negatively impacting both LCP and FCP. We suggest evaluating the possibility of removing the preloader altogether or reworking its logic.
- Solution:
✓ Site code adjustments to turn off lazyload for the largest media files.
✓ Integration of preload elements into the site code for the largest elements, ensuring they load with priority.
✓ Refinement of preloader logic to minimize its impact on LCP and FCP indicators.
Interaction with Cumulative Layout Shift (CLS) and Total Blocking Time (TBT)
Taking away the preloader has an impact on changes in the CLS (Cumulative Layout Shift) metric.
CLS measures how long it takes for controls to shift their position or size during page loading, like loading images, fonts, and initializing sliders.
While the indicator is typically normal when changes in element size are masked by the preloader, removing the preloader for LCP improvement can lead to an immediate decline in CLS. This trade-off necessitates meticulous analysis and optimization to strike a balance between both factors.
Optimization of the download queue of JS and CSS files
It’s also crucial to organize the order in which JS and CSS files load. A good strategy is to put files that directly impact what you see first on the page at the beginning. Other files can join in after the main stuff is already loaded. Doing this will make Total Blocking Time (TBT) and First Contentful Paint (FCP) better.
Making files smaller helps pages load faster, especially on phones with limited data.
These metrics can also be improved by configuring resource caching. We can do this using the CMS (like WordPress) or on the server. Saving things locally means that when people come back to the page, things load up faster, making the whole site quicker.
With the help of “webspeedtest cloudinary”, we learned how to go beyond simple image compression. The site analyzes image sizes, format, encoding quality and tangential factors that can significantly increase page load speed.
Visual checking and saving of important design elements after optimization
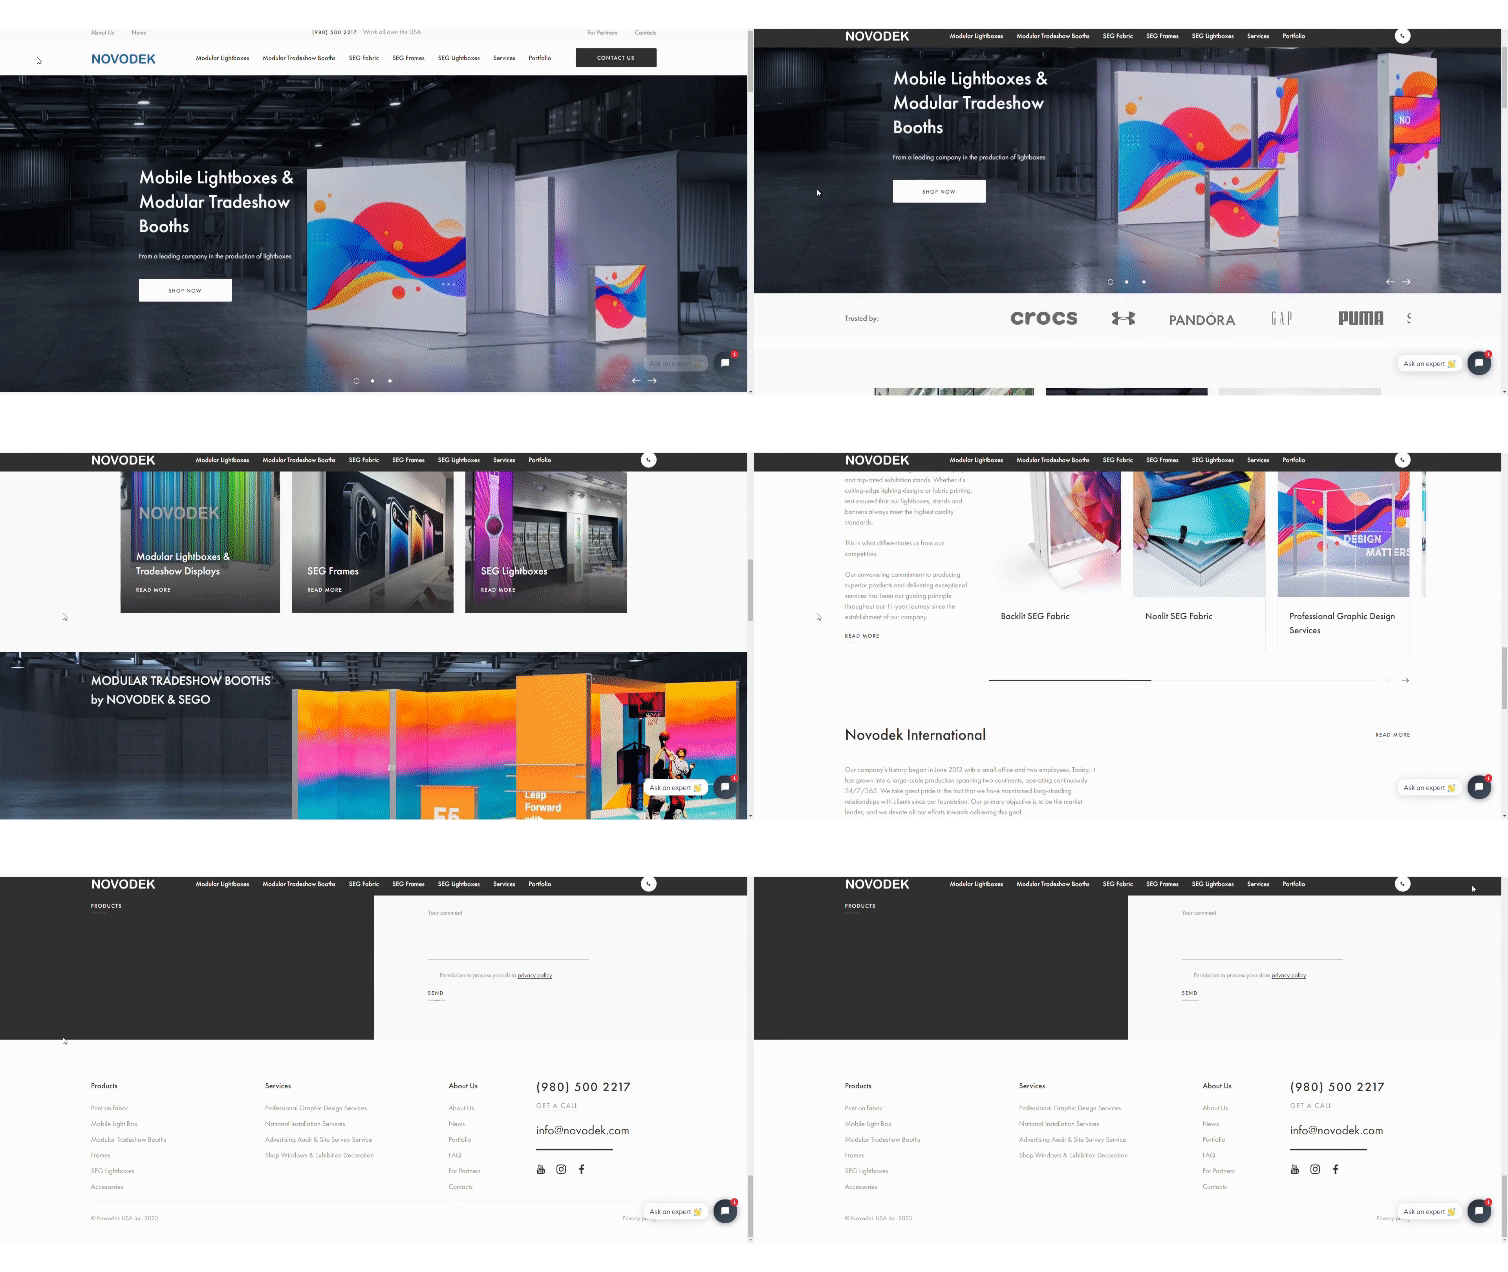
Making all these improvements might change how the site looks. So, it will take some extra time to adjust and make sure everything still looks good. Keeping the important design parts right is key for a good user experience.
We improved the Novodek online store, making it faster, but we kept the important design and brand style. This helps people recognize and remember the brand better.
Results
It took us 30 hours to make these website speed improvements. As a result, we got an improvement in website download speed scores, as we planned in the technical task.
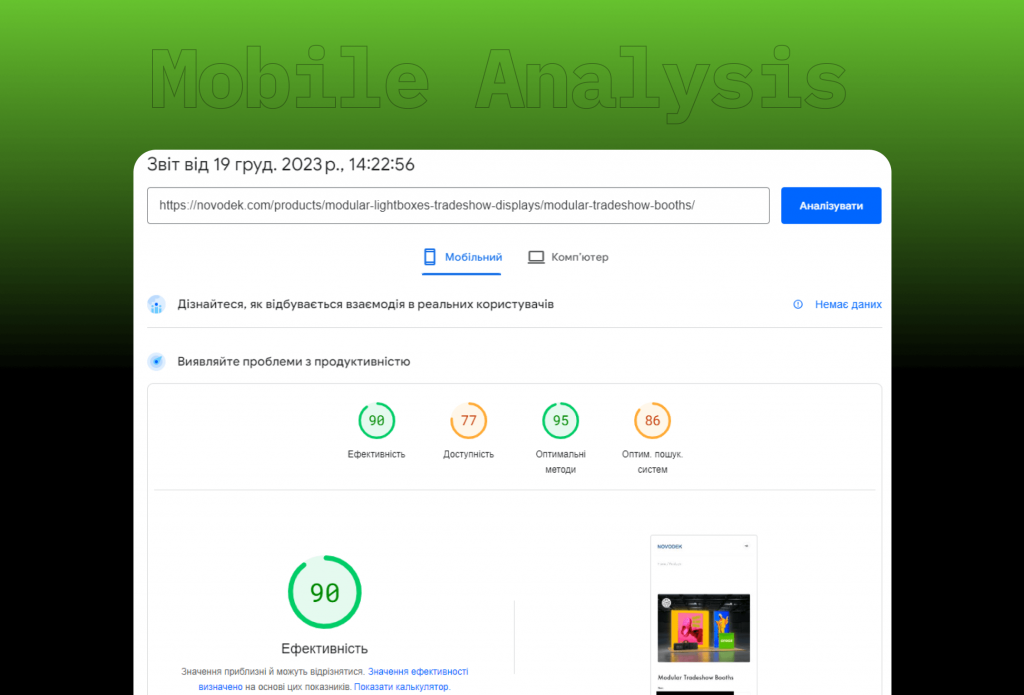
We achieved particularly impressive results for mobile devices. While we initially aimed to raise the indicators to a level near the yellow zone with a rating of 70, in reality, we achieved a level of 90 in terms of site loading speed on mobile devices.
As a result, PageSpeed optimization not only completed the tasks but also uncovered new possibilities to enhance overall performance and guarantee a high level of satisfaction for Novodek online store users.
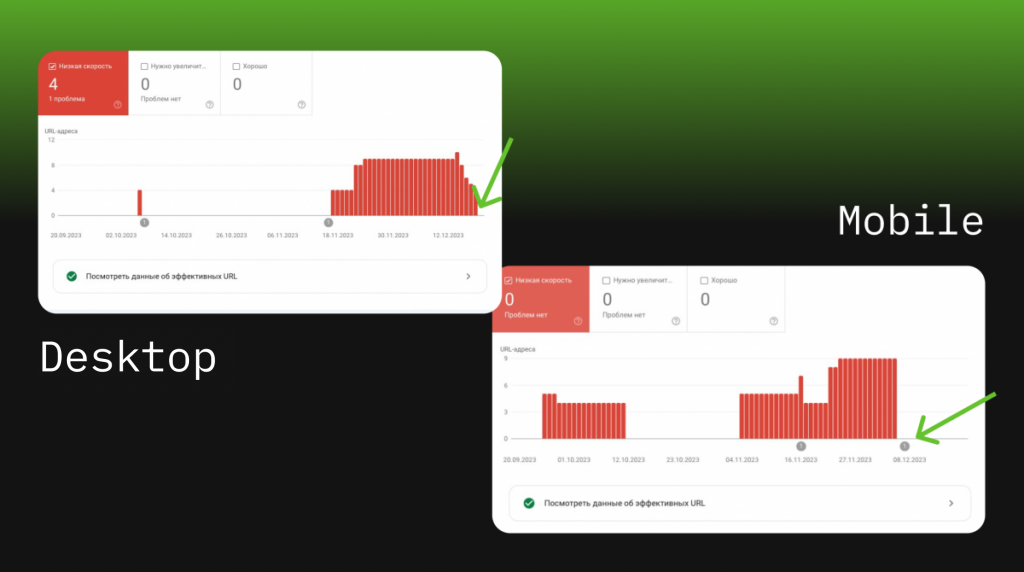
Data from Google Search Console provided by the client. It shows how many pages there were with low speed VS how many remained for the date after the work was done.
Did you spot a ‘pain point’ in this article? Looking to enhance user experience, boost conversions, and speed up your site loading?
Reach out to us, and we’ll tailor and implement personalized solutions to optimize the PageSpeed Insights indicators for your online store.

